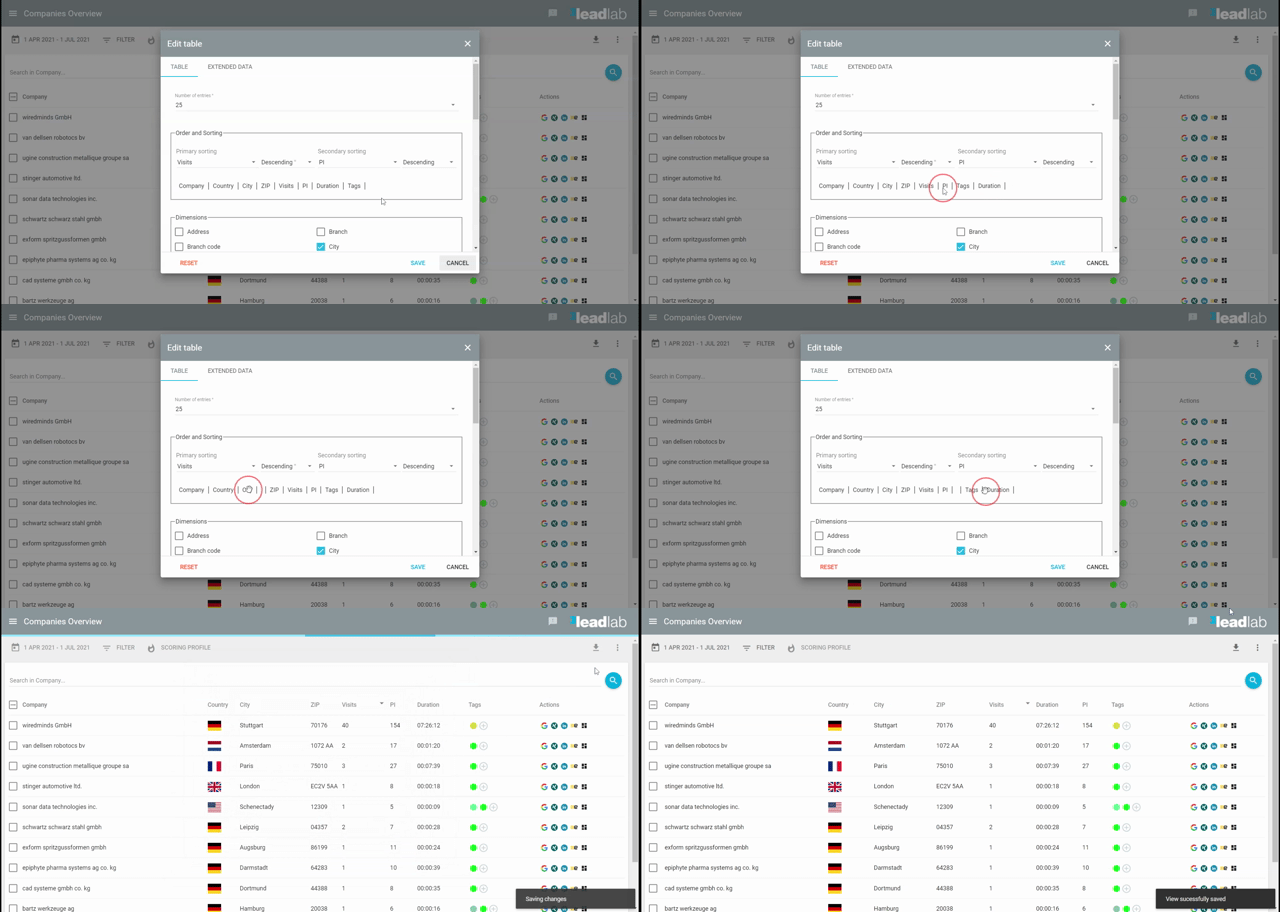
In the “Edit table” menu, you can set various options for displaying the data in the desired statistics. Among other things, you can specify here how much data should be output per page.
Why should I change the default view??
A user is configured in LeadLab with a default view. You should adjust this according to your requirements. For an employee from the Marketing department, other measurement values are usually important than for an employee from the Sales department. You can customize the view under Menu – Edit View – Edit Table.
Options in the Edit table menu:
Displayed entries
Here you can set how many results should be displayed on one page. You can choose between 10, 25, 50 and 100 entries. More entries per page can make evaluations clearer, but they also result in longer loading time.
Arrangement and sorting
You can specify both the primary and secondary default sort order, as well as change the positions of the individual measured values by “drag and drop”.

You can choose between the following measurement values:
Address, beDirect ID, Rating, Industry, Industry Code, Crefo. No., Domain, First Visit, Company, Company Size, Total Visits, Year Established, Contacts, Continent, Country, Marks, Note, Zip Code, Region, City, Street, Phone, Tracking Domain, Sales, Sales Class’ tab_head_2=’Measurements’ tab_content_2=’Exit pages, Custom events, Domains, Visits, Visits (%), Downloads, Entry pages, Events, External links, Campaigns, MailTo links, Milestones, PIs, Score % (Max), Score % (Ø), Score (Max), Score (Ø), Pages, Search phrases, Unique visitors, Dwell time
Immediately load measured values that require a lot of processing time
All measurement values marked with a blue exclamation mark are loaded immediately in the default setting. If you want to reload the values only by clicking on the respective value, disable this option. This can significantly increase the loading speed if you have a large amount of data.
Save global view
You can create and save several default views in your user, so that you can switch between them for different analyses. To do this, click on More-> Save global view and assign a meaningful name. This is then clickable with the corresponding configuration under “More”.
